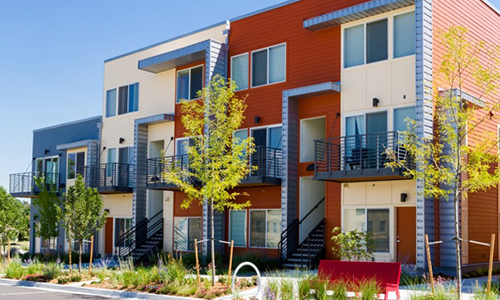
Rent growth is expected to soften in the coming year, though the lack of affordable rentals is expected to continue.
Based on housing market research published throughout the year, the Apartment List Rentonomics team has analyzed the most important trends of 2017 and determined their potential impact / outlook on housing in 2018.
Homeownership
Following 12 years of negative growth, from 69.2% in 2004 to 62.9% in 2016, the U.S. homeownership rate appears to have hit its bottom and even increased slightly in 2017, up to 63.9% as of the third quarter. 2016’s homeownership rate was the lowest since 1965, while 2017’s homeownership rate was the highest since 2014.
Apartment List expects the homeownership rate to stabilize in 2018, or even increase slightly, as more millennials purchase homes. A lack of affordable starter homes for first-time buyers may curb increases in the homeownership rate for the next few years, however.
Conversely, the number of renter households in the U.S. increased by 19.2% between 2005 and 2016, from under 37 million to nearly 45 million. During the same period, the number of owner households increased by 0.9%, from 74 million to 75 million. Despite millennial movement into homeownership, Apartment List predicts the overall number of renter households will continue to grow.
Rental Affordability
The share of cost-burdened renters in the U.S. fell from 50.6% in 2015 to 49.7% in 2016, down to the lowest level since 2008. While renter income growth has outpaced rent growth over the past five years, this is largely due to an increase in higher-income renters. The share of renters earning over 120% of the area median Income rose by 4.2% from 2005 to 2016, and the share of low-income renters decreased by about the same amount. In certain metros, such as San Francisco and Denver, the growth of the higher-income renter segment is even higher.
According to the Harvard Joint Center for Housing Studies, future increases in the homeownership rate may be driven by high-income renter households buying homes, which may affect overall affordability figures.
Multifamily Supply and Softening Rent Prices
Occupancy rates have fallen in the markets with the most new multifamily construction. In Dallas, overall occupancy fell from 92.3% in October 2016 to 91% in October 2017 as new deliveries rose from 15,459 in 2016 to 22,851 in 2017. Slight occupancy-rate declines have also been observed in tight-supply markets such as Denver and Seattle as new properties enter the market.
Los Angeles, San Francisco, and Portland, Ore., have observed rising occupancy rates despite the high multifamily construction volume, given the metros’ active employment markets and severe housing undersupply. Houston’s occupancy rate also has risen as homeowners affected by Hurricane Harvey have moved into the city’s available rentals.
The market is on track to deliver over 250,000 new units in Reis’ top 82 markets in 2017, the highest level of new-supply growth since the late 1980s.
National rent growth was negative in the fall of 2017, after two years of flat rent growth during the same time of year. Apartment List attributes the negative growth to the current glut of new multifamily units. Developers plan to deliver more than 100,000 new units per quarter nationwide from mid-2017 to mid-2018, up from 80,000 over the past year, and the market is on track to deliver over 250,000 new units in Reis’ top 82 markets in 2017. This marks the highest level of new-supply growth since the late 1980s.
Most of these deliveries are for higher-end properties. These properties hold the potential to alleviate market pressure at the mid-priced end if higher-income renters are drawn to them.
Affordable-Rental Shortages
From 2005 to 2016, the number of occupied rental units priced under $800 fell by 1.2 million units, while the overall stock of units rented rose by 5.9 million units. The share of occupied rentals priced under $800 fell from 41.9% to 33.1% over the same period. The share of rentals costing more than $2,000 per month rose from 4.7% to 8.4% from 2005 to 2016.
Very few apartments remain affordable for very low-income families, defined as those earning less than 50% of the area median income. From 2010 to 2016, the share of apartments priced in this range fell from 11.2% to 4.3%.
One in four renters in the country is severely cost-burdened, defined as those spending over 50% of their income on rent. In New Orleans and Los Angeles, this share is even higher — in the two metros, about 31% of renters are severely cost-burdened. Of the 100 largest U.S. metros, only six have severely cost-burdened renter rates under 20%. This lack of affordable rentals is expected to continue into 2018, as much of the new construction is aimed at higher-income renters.
By Mary Salmonsen | Hanley Wood Media, Inc. | Friday, December 29, 2017
SHARE THIS ARTICLE ON YOUR FAVORITE SOCIAL NETWORK
